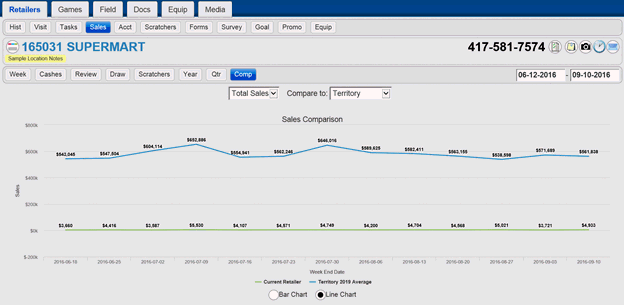
This page allows you to view graphs comparing the selected retailer weekly sales to that of the average in the district, zip code, business type, sales quartile. Touch the Comp link under Sales to view.
Use the drop downs to select the average to compare to and whether to compare instant sales, online sale or total sales. Any date range can be selected (default is past 13 weeks)

Scratchers Price Point Sales Page